Das „Funktionenmikroskop“
> restart; with(plots): with(plottools):
fnt:= 'font = [COURIER, 12]':
interface(displayprecision = 3):
interface(displayprecision = 3):
Definition einer Funktion f;
Definition einer bestimmten Stelle x0 innerhalb des
Definitionsbereichs von f:
> f:= x -> 0.001*x^3 - sin(x^2);
x[0]:= 2;

Steigung m der Tangente an das Schaubild von f im Punkt P(x0|f(x0)):
> m:= D(f)(x[0]);
![]()
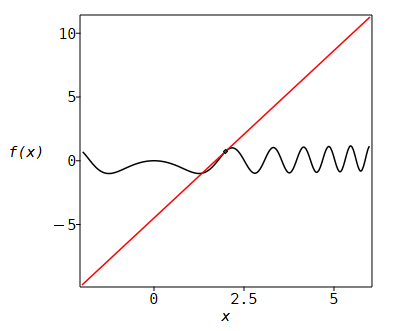
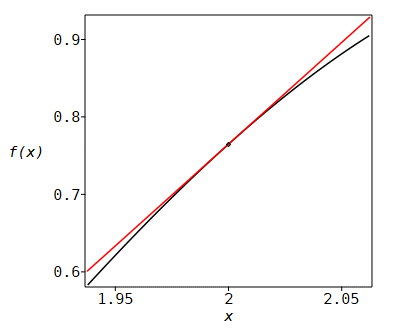
Zeichnen des Schaubildes von f für x0
- h < x < x0 + h;
Zeichnen der Tangente an das Schaubild von f an der Stelle x0:
> pic:= proc(xp, h)
local R, S, xdef, opts, schaubild, punkt, tangente;
R:= [xp - h, f(xp) - m*h]:
S:= [xp + h, m*h + f(xp)]:
xdef:= x = (xp - h)..(xp + h):
opts:= color = black, tickmarks = [3, 4], fnt:
schaubild:= plot(f(x), xdef, opts):
punkt:= PLOT(POINTS([xp, evalf(f(xp))])):
tangente:= line(R, S, color = red):
display([schaubild, tangente, punkt],
axes = boxed,
size =[380, 320],
labelfont = [Courier, 12, italic],
labels = ["x", "f(x)"]);
end:
Schrittweises „Vergrößern“ des Schaubildes von f in der Umgebung von P:
> h:= 16:
for i from 1 to 5 do
pic(x[0], h/4^i);
od;
pic(x[0], h/4^i);
od;


