Deterministisches Chaos
> restart; with(plots): with(geometry):
interface(displayprecision = 3):
Definition des maximalen Ausgabebereichs:
> re_min:= -2;
re_max:= 0.5;
m_min:= -1.125;
im_max:= 1.125;
m_min:= -1.125;
im_max:= 1.125;

Herstellung von Punktfolgen (→ mandelbrot.htm) gemäß der Iterationsvorschrift zneu = zalt2 + c:
> iteration:= proc(re_c, im_c, depth)
local i, z_new, z_old, c, re, im:
global P;
z_new:= 0 + I*0:
c:= re_c + I*im_c:
P:= {}:
i:= 0:
while ((i < depth) and (abs(z_new) < 2)) do
z_old:= z_new:
z_new:= z_old^2 + c:
re:= Re(z_new):
im:= Im(z_new):
if ((re > re_min) and (re < re_max) and
(im > im_min) and (im < im_max)) then
P:= P union {[re,im]}:
fi:
i:= i+1:
od:
end:
global P;
z_new:= 0 + I*0:
c:= re_c + I*im_c:
P:= {}:
i:= 0:
while ((i < depth) and (abs(z_new) < 2)) do
z_old:= z_new:
z_new:= z_old^2 + c:
re:= Re(z_new):
im:= Im(z_new):
if ((re > re_min) and (re < re_max) and
(im > im_min) and (im < im_max)) then
P:= P union {[re,im]}:
fi:
i:= i+1:
od:
end:
Plot-Optionen:
> opts:= 'symbol = POINT,
color = black,
axes = boxed,
scaling = CONSTRAINED':
axes = boxed,
scaling = CONSTRAINED':
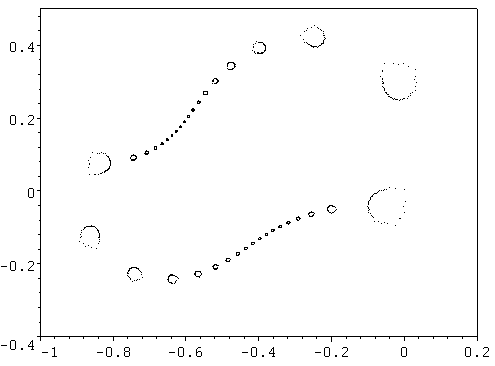
Darstellung der Punktfolge beispielsweise für c = -0,7447 + 0.08514i:
> iteration(-0.7447, 0.08514, 2500);
pointplot(P, view = [-1..0.2, -0.4..0.5], opts);
2500

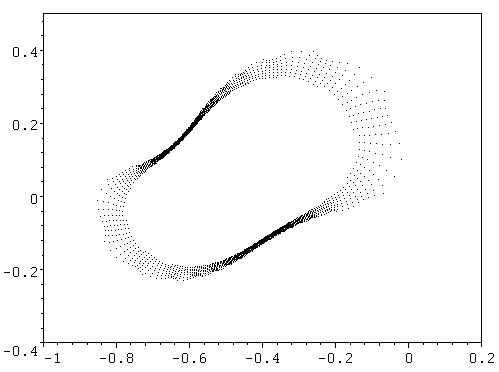
Darstellung der Punktfolge beispielsweise für c =
-0,7445 + 0.08515i:
> iteration(-0.7445, 0.08515, 2500);
pointplot(P, view = [-1..0.2, -0.4..0.5], opts);
2500

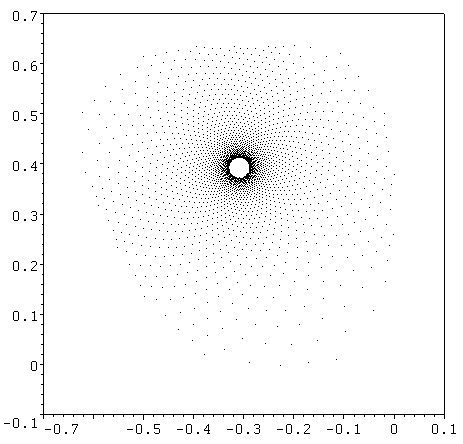
Darstellung der Punktfolge beispielsweise für c =
-0,25 + 0.635i:
> iteration(-0.25, 0.635, 2500);
pointplot(P, view = [-0.7..0.1, -0.1..0.7], opts);
2500

