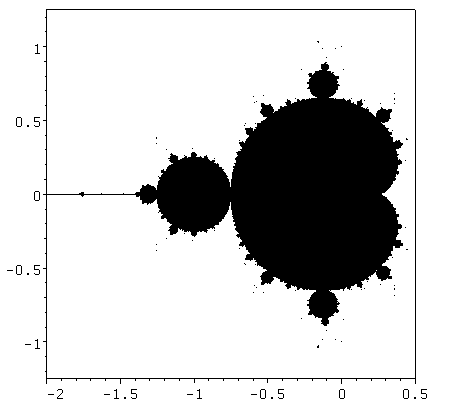
Die Mandelbrotmenge
> restart; with(plots): with(geometry):
Die Prozedur mandel überprüft, ob der Punkt (x;y) ein „Konvergenzpunkt“ ist oder nicht:
> mandel:= proc (x, y, i_max)
local xc, yc, xOld, yOld, xNew, yNew, i;
xc:= x: yc:= y:
xNew:= 0: yNew:= 0:
i:= 0:
while ((xNew*xNew < 4) and (i < i_max)) do
xOld:= xNew: yOld:= yNew:
xNew:= xOld*xOld - yOld*yOld + xc:
yNew:= 2*xOld*yOld + yc:
i:= i + 1;
od:
if i = i_max then 1 else 0 fi;
end:
xc:= x: yc:= y:
xNew:= 0: yNew:= 0:
i:= 0:
while ((xNew*xNew < 4) and (i < i_max)) do
xOld:= xNew: yOld:= yNew:
xNew:= xOld*xOld - yOld*yOld + xc:
yNew:= 2*xOld*yOld + yc:
i:= i + 1;
od:
if i = i_max then 1 else 0 fi;
end:
Definition des Ausgabebereiches und der Auflösung des Bildes:
> depth:= 1000;
xAnf:= -2;
xEnd:= 0.5;
yAnf:= -1.25;
yEnd:= 1.25;
xStep:= (xEnd - xAnf)/depth;
yStep:= (yEnd - yAnf)/depth;
xEnd:= 0.5;
yAnf:= -1.25;
yEnd:= 1.25;
xStep:= (xEnd - xAnf)/depth;
yStep:= (yEnd - yAnf)/depth;

Berechnung von Punkten der Mandelbrotmenge:
> M:= {}:
anz:= 0:
Startzeit:= time ():
x:= xAnf - xStep:
for i to depth do
x:= x + xStep:
y:= yAnf - yStep:
for j to depth do
y:= y + yStep:
if (mandel(x, y, 800) = 1) then
anz:= anz + 1:
P||anz:= [x, y]:
M:= M union {P||anz}:
fi:
od:
od:
Laufzeit:= time () - Startzeit:
Startzeit:= time ():
x:= xAnf - xStep:
for i to depth do
x:= x + xStep:
y:= yAnf - yStep:
for j to depth do
y:= y + yStep:
if (mandel(x, y, 800) = 1) then
anz:= anz + 1:
P||anz:= [x, y]:
M:= M union {P||anz}:
fi:
od:
od:
Laufzeit:= time () - Startzeit:
Graphische Darstellung der Mandelbrotmenge:
> pointplot(M, view = [-2..0.5, -1.25..1.25],
symbol = POINT,
color = black,
axes = boxed
axesfont = [COURIER, 12],
scaling = CONSTRAINED);
color = black,
axes = boxed
axesfont = [COURIER, 12],
scaling = CONSTRAINED);

Rechentechnische Details:
> anz*Mandelbrotpunkte;
Berechnungszeit:= round(Laufzeit/60)*Minuten;
![]()

